US Gulf:
NOLA urea narrowed to $288-$298/st FOB for July
business during the week, falling within the prior week’s broader $288-$302/st
FOB range. Very limited trading was confirmed ahead of the Southwestern
Fertilizer Conference in Nashville, Tenn., on July 14-18.
US Imports:
Urea
imports firmed 14.1% in July-May, to 5.22 million st from 4.58 million st in
the same period of 2022-2023. May imports were off 38.0%, however, dropping to
478,348 st from the year-ago 771,385 st.
July-May
imports from Russia were 1.53 million st. Qatar sent 1.10 million st, Algeria
shipped 569,381 st, and Saudi Arabia sent 485,933 st.
US Exports:
May
urea exports were noted at 51,103 st, a 39.6% increase on the year-ago 36,610
st. July-May volumes were off 43.2%, however, at 762,091 st compared to the
1.34 million st reported one year earlier.
Exports
to Canada totaled 548,125 st in July-May, followed by 93,519 st to Mexico and
77,185 st to Chile.
Eastern Cornbelt:
Urea
was unchanged at $365-$375/st FOB in the Eastern Cornbelt, with the low
confirmed at Cincinnati, Ohio, and the high out of inland warehouses. Most
Illinois River terminals remained at the $370/st FOB level for July-August
tons. The low end of the Great Lakes urea market was steady at the $365/st FOB
level in Michigan.
Western Cornbelt:
Urea in the Western Cornbelt remained at $345-$365/st
FOB, with the low reported at St. Louis, Mo. The Port Neal, Iowa, market was
pegged at $350-$355/st FOB for limited offers on forward sales.
Northern Plains:
Urea
remained at $360-$380/st FOB regional terminals in the Northern Plains.
Inventories were described as very tight, with the higher end of the range
confirmed for limited offers for forward sales at St. Paul, Minn. Delivered
urea was pegged at $400-$440/st in North Dakota, with the low out of unit train
facilities.
Northeast:
Urea pricing in the Northeast
slipped to $370-$375/st FOB Fairless Hills, Pa., and $375-$380/st FOB
Baltimore, Md., down $10/st from mid-June.
Eastern Canada:
Urea remained in a broad range at C$592-$700/mt FOB
in Eastern Canada in mid-July.
India:
The
Indian Potash Ltd. (IPL) tender closed on July 8. Nineteen companies offered a
total of 2.7 million mt, though many of those offers are likely duplicates,
sources said.
OQ Trading set the lowest price for East Coast delivery, offering 100,000 mt at $365/mt CFR, about $26/mt above the East Coast price from the March Rashtriya Chemicals and Fertilizers Ltd. (RCF) tender. The lowest West Coast offer came from Liven at $350.50/mt CFR for 50,000 mt, a $2.50/mt increase on the West Coast award in the prior Indian tender.
IPL Urea Tender Results
|
Offering Company
|
Quantity WCI
|
$/mt CFR
| |
|
Liven
|
50,000
|
350.50
| | |
|
OQ
Trading
|
300,000
|
351.00
| | |
|
Continental
|
100,000
|
352.00
| | |
|
Medallion
|
50,000
|
353.10
| | |
|
ETG/Agricommodity
|
45,000
|
355.50
| | |
|
Samsung
|
90,000
|
358.70
| | |
|
Alkagesta
|
45,000
|
360.00
| | |
|
Aditya
Birla
|
50,000
|
368.40
| | |
|
Indagro
|
42,500
|
369.40
| | |
|
Fertiglobe
|
45,000
|
370.00
| | |
|
Hexagon
|
50,000
|
371.26
| | |
|
Ameropa
|
194,300
|
372.00
| | |
|
FertiStream
|
47,500
|
372.00
| | |
|
Dreymoor
|
90,000
|
372.00
| | |
|
RE
Energy
|
50,000
|
372.91
| | |
|
Midgulf
|
100,000
|
377.00
| | |
|
MacroSource
|
45,000
|
379.50
| | |
|
Koch
|
47,500
|
379.80
| | |
|
Total
|
1,441,800
|
| | |
|
Offering Company
|
Quantity ECI
|
$/mt CFR
| | |
|
OQ
Trading
|
100,000
|
365.00
| | |
|
ETG/Agricommodity
|
45,000
|
366.00
| | |
|
Continental
|
100,000
|
366.00
| | |
|
Samsung
|
90,000
|
367.70
| | |
|
Medallion
|
50,000
|
368.10
| | |
|
Alkagesta
|
45,000
|
370.00
| | |
|
Hexagon
|
50,000
|
371.26
| | |
|
Indagro
|
42,500
|
373.40
| | |
|
Sun
International
|
100,000
|
374.15
| | |
|
Fertiglobe
|
45,000
|
377.00
| | |
|
Aditya
Birla
|
50,000
|
377.40
| | |
|
Koch
|
47,500
|
377.90
| | |
|
Ameropa
|
194,300
|
378.00
| | |
|
Dreymoor
|
90,000
|
378.00
| | |
|
FertiStream
|
47,500
|
379.00
| | |
|
Midgulf
|
100,000
|
382.00
| | |
|
MacroSource
|
45,000
|
385.50
| | |
|
Total
|
1,241,800
|
| | |
Sources
drew immediate attention to the wide price gap between the two coasts. While
the disparity typically runs close to $5/mt to account for the extra freight
costs from the Arab Gulf to the East Coast, the current tender’s nearly $15/mt
gap can provide Arab Gulf suppliers with better netbacks for East Coast sales
compared to the West Coast.
As
Chinese urea is not available in large quantities, sources had predicted that
Arab Gulf and Russian material would dominate the tender offers. The West Coast
price represents a netback to Russian Baltic ports of $290/mt FOB and to Arab
Gulf producers in the low-$330s/mt FOB, a lackluster level for both groups. The
estimated East Coast netback to the Arab Gulf was put in the low-$340s/mt FOB,
however, a price that has already been achieved from the AG and a level that
producers want to maintain.
Counterbids
were initially made to the next 10 lowest offers for West Coast delivery. One
trader said the move made sense, as the landed price was much lower than the
East Coast price. As the July 10 deadline approached, however, there were no
responses to the counterbids, prompting IPL to extend the deadline to July 11.
Reports
indicate that two shipments totaling 80,000 mt were ultimately offered. Sources
said Continental and Aditya Birla will be supplying the product.
Rumors
that IPL was ready to counterbid East Coast deliveries despite the higher price
were reported late on July 11. Sources said IPL issued the counterbids to all
the companies offering tons for West Coast ports.
The
Liven and OQ Trading offers secured 150,000 mt for IPL. The rumored additional
80,000 mt from Continental and Aditya Birla puts IPL’s potential take at
230,000 mt, well below even the most pessimistic predictions for the tender.
Going into the tender, sources were expecting purchases up to 700,000 mt, with
the Arab Gulf supplying at least 400,000 mt of that amount.
However,
the low West Coast price established a netback to the Arab Gulf well below what
producers were willing to take. Soon after the prices were revealed, several
traders began discussing a maximum purchase of just 400,000 mt, and possibly as
little as 300,000 mt. The East Coast netback, however, is closer to the
producers’ desires, leaving the possibility that additional tons might still be
secured.
The
next lowest offers for the West Coast were from OQ Trading with 300,000 mt at
$351/mt CFR and Continental’s 100,000 mt at $352/mt CFR. Facing a spread of
just $0.50/mt and $1.50/mt, respectively, from the lowest price, sources said
these two companies might have been able to accept the IPL counterbid without a
major financial impact.
As
previously noted, however, only Continental has accepted the counterbid, and
with fewer tons than in the initial offer. Because of the better netbacks
offered in the $365/mt CFR East Coast price, more companies are likely to
accept the counterbid.
The tender’s shipping deadline is Aug. 27. Regardless of how many tons IPL ultimately buys, sources said India’s next tender is unlikely to be called before late August.
Pakistan:
Trading
Corp. of Pakistan (TCP) called a tender for 150,000 mt to close on July 29. The
call came after talks with Turkmenistan for a government-to-government supply
deal reportedly fell through.
The
TCP tender calls for the tonnage to arrive by Sept. 25. The documents divide
the deliveries into three distinct periods in August, with each period
involving either one 50,000 mt cargo or two 30,000 mt shipments. The size of
the vessel will be determined by the discharge port.
The
government earlier approved the import of 200,000 mt of urea. In recent years,
TCP arranged government-to-government deals after that authorization was
granted. The last was in late 2023, when TCP bought 220,000 mt from Azerbaijan,
Russia, and the UAE.
The
use of government-to-government deals has been helpful to Pakistan, which
maintains limited hard currency reserves. These limited funds – and the
possibility of delayed payment – have in the past led some traders to avoid
participating in tenders.
Black Sea:
Black
Sea prilled urea moved up to $310-$315/mt FOB.
Mediterranean:
European
buyers have been closely watching developments with the IPL urea tender and in
Egypt, where gas supply has been restored and producers are reportedly ramping
up operations. Buyers in the Mediterranean are in no rush, however, as
highlighted by the lack of new indications and inquiries in Spain and Italy.
In
France, liquidity for fresh offshore tons was reported around $400/mt CFR,
while FCA prices reflected closer to a $410/mt CFR equivalent. This week,
granular urea in the Mediterranean was quoted higher at $385-$400/mt CFR.
Southeast
Asia:
The Southeast
Asia granular urea market was reported at $350-$366/mt FOB this week. Pupuk
Indonesia awarded its 30,000 mt granular urea tender, which closed on July 5at $366/mt FOB Bontang, to the buyer Universal Harvester. No further
granular sales were reported, with Petronas still down at Bintulu and Brunei
reportedly committed through August.
Indonesia:
Pupuk
surprised the urea industry by calling a selling tender for 30,000-45,000 mt of
granular urea to close on July 5, before the close of the Indian tender. Prices
from the Pupuk tender were released just as the numbers from the Indian tender
were also becoming available.
Pupuk
sold 30,000 mt at $366/mt FOB to Universal Harvester, of the Philippines,
surprising many players. Recent sales from regional producers Malaysia and
Brunei had closed in the low-$350s/mt FOB. Going into the tender, sources were
predicting a price range of $350-$352/mt FOB out of Indonesia.
Universal
Harvester may have been under pressure to supply material to a contract holder
in the Philippines, one trader speculated, and bid a high price to ensure it
got the tons it needed. As the week closed, sources had not heard of any
additional sales at the tender’s price level.
After
a Pupuk granular tender is awarded, the producer normally engages in talks with
other potential buyers. Pupuk’s last tender, for 45,000 mt, settled at $312/mt
FOB. Following talks with other buyers, Pupuk ultimately sold 278,000 mt at the
tender price.
The
high price in the new tender appears to be keeping potential buyers away,
however. Sources said it would be very difficult for a trader to find a home
for the product at the current price level.
Middle
East:
Arab
Gulf producers were expected to be the primary suppliers of urea in the
IPL/Indian tender, and sources estimated that at least 400,000 mt would find
its way from the Middle East to Indian ports.
However,
the lowest West Coast price of $350.50/mt CFR indicates a netback well below
producers’ pricing expectations. Pricing to India’s East Coast at $365/mt CFR
appears to offer a better opportunity for producers.
The
large price gap between the East and West Coasts allows for a higher netback to
the Arab Gulf if sales can be made under the Indian tender. Because of the
lower price, however, IPL’s first counterbid was only made to traders who
offered sales into India’s West Coast. The netback to the Arab Gulf from the
West Coast price was put in the mid-$330s/mt FOB, well below producers’
expectations.
The
estimated netback from an East Coast sale falls in the low-$340s/mt FOB, an
area where producers have already secured deals. While an East Coast sale would
not push the price into the $350s/mt FOB as producers have been arguing, it
also does not force a price reduction.
Egyptian
production is reportedly ramping up as natural gas supplies return to normal.
MOPCO already has two plants operating at 80% of rated capacity, sources said,
and other facilities were also said to be nearing an 80% production rate. Only
a few smaller companies are taking longer to return to normal output.
Producers
need the tons currently being manufactured not only to build reserves, sources
said, but also to replace tons sold under swap deals during the short period
when production was halted. If production rates continue to increase, one
trader said the producers will be in good shape to offer tons for August and
September shipment.
For
now, the focus is on covering old deals and building reserves, and no new spot
sales were reported from the area.
China:
Sources
described prilled and granular urea at parity when discussing estimated export
prices for the week. Mixed messages are coming out of China, however, with some
reports citing an export-equivalent price in the upper-$320s/mt FOB and others
claiming a price in the low-$330s/mt FOB.
The
variance could easily be attributed to differences in plant location and
regional urea demand, one trader noted. Regardless of the price level, however,
sources said prices are still too high and reserves too low for government
export inspectors, and players do not anticipate any urea exports of
significance until September.
Reserves
are expected to begin building this month and into August as more plants slowly
ramp up production. Some production facilities are coming off routine
maintenance turnarounds, while others are reacting to the government’s
encouragement to step up production. The government is reportedly anxious to
see plants operating at 80% of rated capacity. The average is reportedly closer
to 60%, with some plants running as low as 20-30% of capacity.
Some
sources are also reporting that the inspection process is being stretched up to
30 days, beyond the usual 14 days. At the same time, the inspectors are also
insisting on reviewing the contracts for exports with a particular focus on
payment methods. This, said one trader, is adding another two weeks to the
review process.
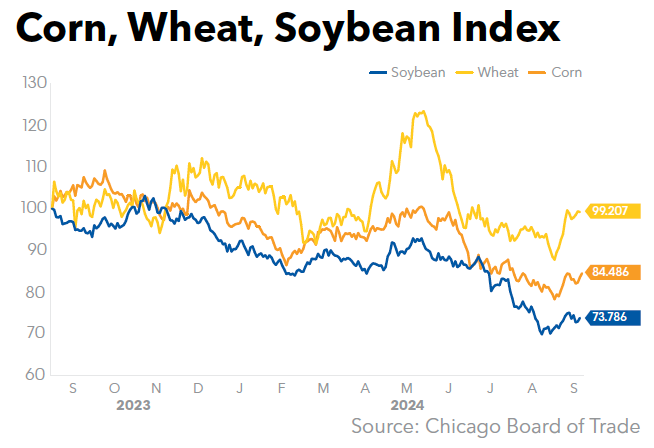
Brazil:
The
decrease in domestic corn prices has incentivized growers to delay nitrogen
purchases for the second corn crop, typically delivered in the fourth quarter.
Ample global supply has further eroded support for higher prices, players said.
Brazil granular urea prices increased $5/mt at the bottom of the range to settle at $360-$365/mt CFR, with new offers reported at $370/mt CFR. Despite widespread availability of sanctioned product during the week, buyers were focused on securing phosphates, resulting in limited demand for nitrogen. Offers were noted at $475-$495/mt FOB Rondonópolis, a $5/mt decline from last week.
January-June
imports firmed 8% year-over-year, Trade Data Monitor reported, to 3
million mt from 2.8 million mt. Nigeria shipped 658,000 mt, followed by Oman
with 574,000 mt and Qatar with 548,000 mt. Second-quarter imports lifted
slightly, to 1.5 million mt from 1.4 million mt in April-June 2023.
June imports totaled 606,000
mt, a more than 50% year-over-year increase, with approximately 25%
of the tonnage coming from Oman. Venezuela added 33,000 mt.