The Mosaic Co. on Jan. 13 announced that it
has completed the sale of Streamsong Resort and approximately 7,000 acres of
land on which it sits to Lone Windmill LLC, a subsidiary of Kemper Sports
Management LLC.
Chicago-based KemperSports has managed the
golf business at Streamsong since the resort opened in 2012, and it has managed
the entire resort for the past two years as part of its KemperDestinations
division.
The purchase price for the resort and real
estate was $160 million. Mosaic intends to use approximately a quarter of the
proceeds of the sale to provide long-term funding for the company’s global
community investment activities. The remainder of the proceeds are available
for general corporate purposes and are subject to Mosaic’s usual capital
allocation strategy, including potential shareholder returns.
“For 10 years Streamsong has demonstrated Mosaic’s ability to put formerly mined land to economically and environmentally productive use,” said Mosaic President and CEO Joc O’Rourke. “It has always been our intention to identify the right long-term steward of Streamsong, and we have clearly done that with KemperSports. Kemper has been an outstanding partner for many years, and we have every confidence that they will continue to build upon Streamsong’s remarkable record of delivering best-in-class guest experiences while providing meaningful employment opportunity and economic impact in Central Florida.
“Streamsong has generated great value for
Mosaic and its shareholders, and this transaction demonstrates Mosaic’s
steadfast commitment to disciplined asset and capital management,”
O’Rourke said. “In addition, funding our community investment work with a
portion of the proceeds from the sale ensures that our communities will
continue to benefit from Streamsong’s legacy for many years to come.”
Tampa ammonia prices for January continued at $975/mt CFR, down $55/mt
from December’s $1,030/mt.
US Imports:
November ammonia imports were recorded at 175,150 st,
according to the US Census Bureau, falling 31.3% from the year-ago 254,775 st.
July-November volumes were noted at 950,493 st, a 14.5% decrease from the
year-ago 1.11 million st.
US Exports:
Ammonia exports were up 1,698.2% in November, to 107,196
st from 5,961 st in the prior November. July-November exports firmed 227.2%, to
589,964 st from the year-ago 180,331 st.
Eastern Cornbelt:
Ammonia prepay
prices remained at $1,095-$1,110/st FOB in the Eastern Cornbelt, with the low
at Lima, Ohio. Most Illinois and Indiana terminals were reported at the
$1,100/st FOB level for prepay offers in early January.
Sources reported mixed results on
year-end business. “We had a good fall. We expected it to eat into prepay and
it did,” said one contact. “Prepay has been nonexistent, very quiet.”
Another source described year-end
business as good. “I
think tax implications played a big part in those numbers at year-end for
several growers,” he said. “I think these markets are still going to need a few
weeks to find flooring to shore them up, as I believe
there are a lot of purchases to be made yet by dealers.”
Western Cornbelt:
Spring prepay offers for ammonia
were unchanged at $1,050-$1,100/st FOB in the Western Cornbelt, with the low in
Nebraska and the high at Palmyra, Mo. Iowa terminals were reported in the
$1,060-$1,070/st FOB range.
Southern Plains:
Ammonia prepay
offers remained at $875/st FOB Woodward, Okla., and Borger, Texas, $900/st FOB
Pryor, Okla., and $950/st FOB Verdigris, Okla. Prompt truck pricing FOB
Beaumont, Texas, was reported at the $880/st FOB level, with some application
taking place in areas where field conditions are favorable.
South Central:
In the wake of the
Tampa January ammonia price drop, truck offers for ammonia out of Gulf Coast
terminals fell to $880-$980/st FOB, depending on location.
Black Sea:
Reports circulated
that Turkey was bidding for product at $810-$820/mt CFR. Even with reports of
softer prices heard across the board, sources said the price was too low for
the current market.
Despite repeated
efforts by the United Nations and Russian companies, no ammonia is coming out
of the Black Sea. Material bought by Turkey is being originating from a multitude
of locations, including the
Caribbean, North Africa, and Southeast Asia.
India:
Buyers of spot
ammonia continue to look beyond the Arab Gulf, while contract buyers are
receiving product that was purchased earlier. Spot buyers seem to be keeping
their focus on getting supplies from China and Southeast Asia producers.
Sources reported no
new deals that would move the price from the previously reported $850-$860/mt
CFR.
Middle East:
Producers were
still said to be asking $900/mt FOB for spot material. They continued to be
countered by ever-lower bids from buyers. Sources are not sure how long Arab
Gulf producers will be able to hold on to their higher pricing ideas. Turkish
buyers are bidding at low prices for material around the world. At the same
time, there are reports of European prices coming off.
The closure of an
OMIFCO ammonia-urea line for 25 days was not expected to impact the market.
Sources noted that the ammonia from the plant is used in the same facility for
urea production and is not for export.
January-November
ammonia exports from Iran were reported at 490,000 mt by Trade Data Monitor,a 5% drop from 517,000 mt shipped during the same period in 2021. Iran’s
main buyer was India, taking 411,000 mt.
November exports
were reported at 71,000 mt, up from 43,000 mt in November 2021. India received
95% of the exports, taking 67,000 mt.
Northwest Europe:
Late-week rumors
indicated new deals were reached at $990/mt CFR. No names of buyers or sellers
were reported, leaving the lower pricing unconfirmed.
A drop in pricing
has been expected as European natural gas prices first stabilized, then started
to come down. Based on the price of gas, sources estimated the new production
cost of ammonia at sub-$800/mt ex-plant.
Brazil:
Trade Data Monitor reported 2022
ammonia imports at 445,000 mt, down about 17% from 534,000 mt imported
in 2021. Trinidad and Tobago remained the market’s main supplier, sending
366,000 mt. The US was the second largest supplier with 34,000 mt, while Qatar
and Argentina each sent 15,000 mt. The US, Qatar, and Argentina sent zero
ammonia to Brazil in 2021.
December imports
were reported at 58,000 mt, nearly double the
30,000
mt noted for December 2021. Trinidad and Tobago accounted for 75% of the
imports with 44,000 mt, followed by the US with 14,000 mt. Fourth-quarter
imports were reported at 126,000 mt, up 41% from 89,000 mt received in the same
period of 2021.
Brazil stepped up
ammonia exports in 2022, shipping 99,000 mt compared to the year-ago 36,000 mt.
South Africa was the largest buyer with 38,000 mt, followed by 18,000 mt
purchased by Morocco. Spain took 15,000 mt.
Sources previously
said they were not surprised by the buying interest from Europe and Morocco.
The Brazilian tons were offered at favorable rates, and buyers were looking for
material to replace the Black Sea tonnage made unavailable by the war in
Ukraine.
NOLA urea barges
dropped as low as $375/st FOB in early-week trading, the first time the market
was recorded trading below $400/st FOB since June 2021. After the fall, prices
gained some strength and were reported rising into the $395-$408/st FOB range
later in the week. The week-ago range was $416-$455/st FOB. Sources cited the
absence of an India tender for the weakness.
US Imports:
November urea imports totaled 563,686 st, off 28.1% from
the year-ago 784,039 st. July-November volumes were counted at 1.33 million st,
a 45.0% decrease from the prior 2.43 million st.
July-November imports from Qatar were 434,086 st,
followed by 262,463 st from Saudi Arabia. Oman moved ahead of Canada’s 136,053
st fertilizer year-to-date total with 236,512 st, while Russia added 126,834
st.
US Exports:
November urea exports moved 165.3% higher year-over-year,
to 67,750 st from 25,541 st. July-November totals were up 784.1%, to 769,233 st
from 87,005 st noted one year earlier.
Eastern Cornbelt:
Driven by a significant drop in NOLA
barge prices during the week, urea terminal prices fell to $480-$500/st FOB in
the Eastern Cornbelt, some $40/st below the prior week. The Cincinnati, Ohio,
market was reported in the $485-$500/st FOB range at midweek.
Western Cornbelt:
Plunging urea prices fueled by
softening NOLA barge values pushed terminal pricing down to $455-$500/st FOB in
the Western Cornbelt, well below the prior week’s $510-$530/st FOB range, with
the high confirmed in Iowa and the low at St. Louis, Mo.
Southern Plains:
Following a plunge
in NOLA barge prices on Jan. 10, urea at Catoosa/Inola, Okla., fell from a high
of $500/st early in the week to a low of $450-$460/st FOB. The Houston, Texas,
urea market was pegged at the $495/st FOB level at midweek.
South Central:
A sharp drop in
NOLA barge prices on Jan. 10 fueled a downward shift in urea terminal prices in
the region. While the week began with prices at the $515/st level FOB Memphis,
Tenn., sources said $480-$495/st FOB was more common out of river terminals by
midweek, with a low of $450/st FOB confirmed at Convent, La., on Jan. 11.
Sources noted, however, that very little new business was being done on urea.
Southeast:
Urea offers were
quoted at $510/st FOB Wilmington, N.C., and Norfolk, Va., down significantly
from the $590/st FOB levels reported in mid-December. No urea was available in
the Savannah, Ga., market in early January.
India:
Sources are now
convinced there will be no spot tender call until mid-February. One trader
noted that the country will first want to get past the IPL tender call for
600,000 mt to be delivered over a one-year period.
The IPL tender
will close Jan. 23 and represents the first time one of the major Indian
importers issued a tender of this type. IPL is asking for a commitment of at
least one cargo per month through February 2024, with each shipment to be
priced at a discount to market values. The tender is open only to producers.
Media reports
indicated that the rising price of natural gas in India could reduce domestic
production. Sources said that even if production is not affected, the higher
production cost will most likely require additional funding for the
government’s urea subsidy program. Urea already accounts for about one-third of
the program’s total fertilizer subsidy expenditures.
Proposals for the
2023-2024 fiscal-year budget are being floated. If the current plans to reduce
subsidies for urea and other fertilizers are enacted, local economists
reportedly told local newspapers that farmers will either cut back on
fertilizer purchases, leading to reduced crop output, or pass on the higher
costs to food buyers. Either way, the increases in food costs could push
inflation rates even higher, the economists said.
Black Sea:
Sources estimated that the prilled urea price from the Black Sea dipped to $370-$405/mt FOB.
Indonesia:
Sources reported
that major producers are focusing their attention on the domestic market
through February. Once exports are opened up, it appears that producers will be
permitted to ship out 1 million mt in 2023, sources said.
Middle East:
Players put the
market out of the Arab Gulf at $420-$440/mt FOB, but with only limited business
as a guide. Sources reported that a small cargo from Qatar, sold to a Turkish
buyer at $430/mt FOB, was the only public deal.
OMIFCO shut down
one ammonia-urea line for 25 days for routine maintenance. The routine closure
will leave the company with only one spot cargo available for shipment in
February. The rest of the remaining output is already booked under long-term
contracts.
Egyptian producers
have once again gone quiet. No new deals from Egypt were reported, despite
earlier hopes by producers to push the price past the $510/mt FOB level set at
the beginning of the month.
Sources reported
that availability of urea from Iran remains limited, and restrictions on
natural gas availability have forced producers to cut back on tons being
offered. Even as supplies are tight, sources reported softer prices. Offers of
$410/mt FOB were reportedly floated, down from the $450/mt FOB discussed as the
year began.
January-November
urea exports were counted at 4.6 million mt, Trade Data Monitor
reported, up about one-third from the 3.5 million mt exported through the same
period in 2021. The main buyers were Turkey with 1.7 million mt, and South
Africa with 553,000 mt.
November exports were
reported at 448,000 mt, up dramatically from 267,000 mt shipped in November
2021. Turkey accounted for 52% of exports with 235,000 mt, while Thailand,
South Africa, and China took about 62,000 mt each.
China:
Sources said that
limited tonnage is available for export. Some traders noted preparations were
already underway to celebrate the Lunar New Year, beginning on Jan. 22. The
Chinese government usually grants a full week off for the holiday, although
many companies give workers additional time to celebrate.
Brazil:
The lackluster
global market is having an impact on Brazil, and prices have softened to
$445-$460/mt CFR. Unconfirmed reports put bidding as low as $430/mt CFR, with
no takers so far.
Urea from
Venezuela was reported getting bids at $420/mt CFR. Venezuela and Iran were noted among sanctioned countries offering
their product for significant discounts. So far, it does not look as if the
holder of the Venezuelan material has accepted the low bids.
The range in
Rondonopolis widened to $590-$660/mt FOB ex-warehouse. Sources said the upper
end came from sellers with no urgency to move product, while the lower end was holders of product looking for prompt shipment.
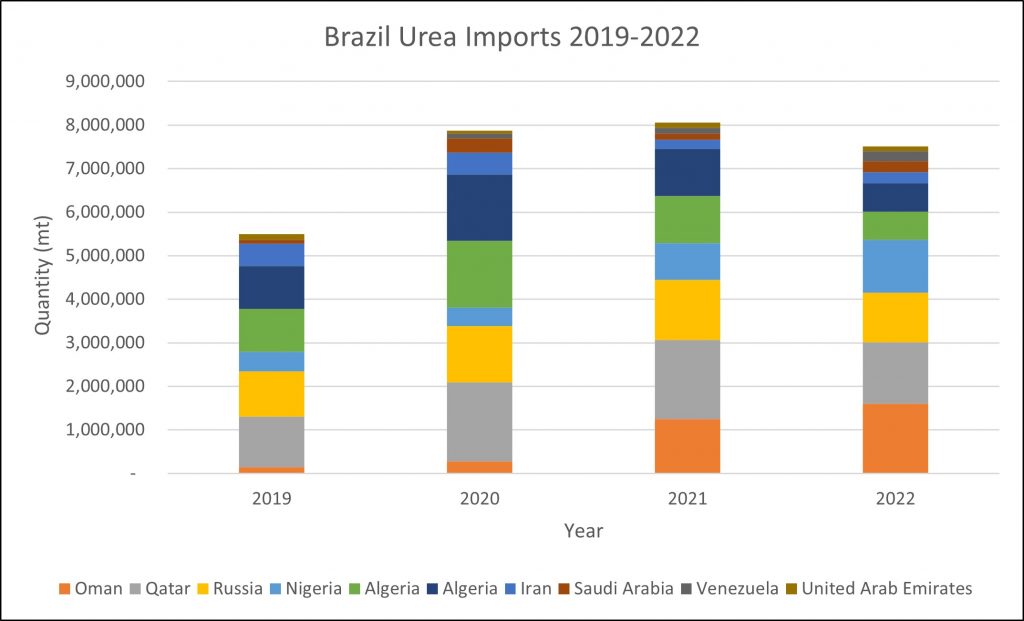
Urea imports for
2022 were down slightly from 2021, according to Trade Data Monitor. Imports
were reported at 7.2 million mt, off from 7.8 million recorded in 2021. The two
top suppliers were Oman with 1.6 million mt and Qatar with 1.4 million mt.
Nigeria shot up to third place with 1.2 million mt, a 44% increase from 2021.
December imports
totaled 710,000 mt, up marginally from the year-ago 680,000 mt. Oman accounted
for about one-third of the December market with 203,000 mt.
Fourth-quarter
imports were down 17%, falling to 2 million mt from 2.4 million mt 2021.
Second-half imports totaled 4.1 million mt, slightly below the year-ago 4.3
million mt.
Ethiopia:
Urea imports
totaled 457,000 mt for 2022, according to Trade Data Monitor, down 14%
from 531,000 mt imported in 2021. Ethiopia’s main suppliers were Egypt with
355,000 mt, followed by the United Arab Emirates with 100,000 mt
Imports were
negligible in December and the fourth quarter. Trade Data Monitor
reported zero imports in both December 2021 and December 2022, while
fourth-quarter 2022 imports totaled just 301 mt, down significantly from
100,000 mt in the prior-year period.
Second-half 2022
imports were pegged at 111,000 mt, off from 188,000 mt in second-half 2021. The
bulk of Ethiopian urea imports usually arrives in the first six months of the
year.
The NOLA UAN barge market was called $420-$440/st ($13.13-$13.75/unit) FOB, down from the previous $450-$460/st ($14.06-$14.38/unit) FOB. Some sources expected the next round of business in the $350-$400/st FOB range.
US Imports:
November UAN imports were noted at 274,900 st, up 8.1%
from 254,387 st in the prior-year period. July-November exports totaled 972,477
st, however, off 15.0% from the year-ago 1.14 million st.
Russia topped the July-November import market with
672,174 st, ahead of 176,926 st from Canada and 110,807 st from Trinidad and
Tobago.
US Exports:
UAN exports for November firmed 915.8% year-over-year, to
245,028 st from 24,122 st. July-November shipments moved 342.5% higher, to 1.29
million st from 290,439 st in the prior year.
Eastern Cornbelt:
UAN-32 was pegged
at $480-$500/st ($15.00-$15.63/unit) FOB regional terminals, with the low
confirmed at Mount Vernon, Ind., for January-February tons and the high at
Seneca, Ill. UAN-28 was quoted as low as $418-$425/st ($14.93-$15.18/unit) FOB
Cincinnati.
Western Cornbelt:
UAN-32 slipped to
$480-$500/st ($15.00-$15.63/unit) FOB in the Western Cornbelt, with the low at
St. Louis and the high reported in the Iowa market.
Southern Plains:
UAN-32 pricing in
the Southern Plains fell to $415-$440/st ($12.97-$13.75/unit) FOB regional
production points, depending on location, down from the previous week’s
$440-$445/st FOB range. One source speculated that there “must be a lot of
product” in tanks because producers “seem willing to make deals now.”
South Central:
UAN-32 pricing was
down significantly in the South Central region. January-February offers were
confirmed in a broad range at $450-$480/st ($14.06-$15.00/unit) FOB, with the
low for truck tons in Louisiana and the high reported by Kentucky sources out
of Ohio River terminals.
Southeast:
UAN-32 pricing out
of port terminals slipped to $535-$540/st ($16.72-$16.88/unit) $554/st
($17.31/unit) FOB in the Southeast, with inland terminals remaining at the
$540-$550/st ($16.88-$17.19/unit) FOB level in Georgia.
July-November ammonium nitrate imports totaled 124,114
st, off 6.6% from the year-ago 132,891 st. November imports were down 37.9%,
falling to 19,547 st from the prior-year 31,469 st.
US
Exports:
November ammonium nitrate exports were reported at 54,192
st, a 68.2% increase on the year-ago 32,227 st. Exports firmed to 256,511 st
for July-November, up 40.6% from the year-ago 182,423 st.
Western Cornbelt:
The ammonium nitrate market dropped to
$560-$570/st FOB Missouri terminals, down $30-$40/st from last report.
Southern Plains:
The ammonium nitrate
market was pegged at $550-$560/st FOB terminals in Oklahoma, down from the
prior $580-$590/st FOB range.
South Central:
The latest ammonium nitrate pricing was
indicated at $520/st FOB Yazoo City, Miss., down $50/st from last report.
Brazil:
The impact of the
Russian export limits on ammonium nitrate were clearly seen in the 2022 Brazil
import numbers supplied by Trade Data Monitor. Imports for the year were
reported at 708,000 mt, down from 1.5 million mt in 2021. Russian product
accounted for all of Brazil’s 2021 imports, while Russia sent just 665,000 mt
in 2022, followed by 27,500 mt from the US.
Even with the
Russian restrictions, December’s 30,000 mt import total nearly matched the
36,000 mt recorded in December 2021. Russia was the sole supplier.
NOLA
barge price ideas continued to move down. Sources called the market
$335-$345/st FOB, below the prior $345-$360/st FOB.
US Imports:
July-November ammonium sulfate imports were off 17.8%
year-over-year, at 282,770 st compared to 344,051 st. November imports stood at
40,585 st, falling 37.8% from the year-ago 65,290 st.
Imports from Canada totaled 164,635 st for July-November,
followed by Belgium with 89,647 st. Tons originating from South Korean were
counted at 17,141 st.
US Exports:
Exports for November stood at 88,917 st, up 217.9% from
the year-ago 27,968 st. July-November exports were seen at 381,510 st, up 52.2%
from the prior-year 250,745 st.
Eastern Cornbelt:
Granular ammonium sulfate pricing was
quoted at $405-$460/st FOB in the Eastern Cornbelt, with the low at Ottawa,
Ill. The Cincinnati market fell in a broad range at $425-$460/st FOB during the
week.
Western Cornbelt:
Granular ammonium sulfate pricing dropped
to $395-$425/st FOB in the Western Cornbelt, with the low confirmed at St.
Louis.
Southern Plains:
Granular ammonium sulfate was pegged at
$405-$430/st FOB in the Southern Plains, down $10/st from last report, with the
low confirmed at Catoosa/Inola and the high at Houston.
South Central:
Ammonium sulfate pricing slipped to
$430-$435/st FOB in the South Central region, down $10-$15/st, with the low
reported at Memphis.
Southeast:
Ammonium
sulfate pricing FOB Hopewell, Va., was steady at $490/st FOB for granular,
$450/st FOB for mid-grade, and $430/st FOB for standard. Pricing in the Florida
market remained at $395/st FOB/DEL for standard and $505/st FOB/DEL for
granular.
China:
Sources reported
steady pricing in the low-$170s/mt FOB, although there were reports of bidding
in the $160s/mt FOB. Sources said the bids are being rejected, but buyers seem
to be getting more aggressive in their efforts to take the price back down.
Brazil:
Sources reported
softer prices at $245-$250/mt CFR. Industry observers pointed to lower freight
rates from China to the Americas as a major influencer on pricing.
Rondonopolis was
reported at $400/mt FOB ex-warehouse on light demand.
Imports of
ammonium sulfate for 2022 totaled 5 million mt, Trade Data Monitor
reported, a 41% increase from 3.5 million mt received in 2021. Chinese
producers supplied the bulk of the material at 4.6 million mt, while Belgium
was a distant second with 160,000 mt.
December imports
stood at 723,000 mt, more than double the 312,000 mt imported in December 2021.
Fourth-quarter imports were 1.9 million mt, up from the year-ago 1 million mt.
Imports totaled 3 million mt in the second half of the year, nearly double the
1.8 million mt recorded in second-half 2021.
DAP trucks
loading from Central Florida remained posted at $650/st FOB, steady from the
prior report. MAP trucks were also noted at $650/st FOB, unchanged from one
week earlier.
North
Florida MAP trucks were priced at $700/st FOB, sources said.
US Gulf:
Sources reported a mixed NOLA phosphate market, with DAP barges firming
from week-ago levels while MAP softened from its recent top.
Domestically-produced DAP barges reportedly changed hands at $625/st FOB
for January and February loading, steady from the prior high, while players
typically noted the weekly floor firming to $620/st FOB, a $5/st increase from
the previous $620/st FOB. Players also reported $620/st FOB pricing in the DAP
paper market.
MAP barges were seen ticking lower, however, with domestic tonnage
trading at $610/st FOB, shy of week-ago price ideas quoted up to $620/st FOB.
Most put the bottom of the range at $605/st FOB, even with the prior MAP floor.
NOLA DAP barges loading in January and February were noted trading in a
$620-$625/st FOB range for the week, rising from $615-$625/st FOB at last
check. MAP barges were tabbed at $605-$610/st FOB, below the week-ago
$605-$620/st FOB.
US Imports:
November DAP imports softened 21.9% from the
prior year, to 61,703 st from 79,046 st. Imports fell 52.4% st for
July-November, to 318,619 st from the year-ago 668,785 st.
Saudi Arabia led July-November imports with
218,741 st, followed by Australia with 80,479 st and 12,534 st from Russia.
MAP/Other imports were off 19.8% in the
July-November period, falling to 381,110 st from 475,436 st in the prior-year
period. Imports moved 46.5% lower in November, to 91,788 st from the year-ago
171,674 st.
Imports from Russia totaled 115,165 st in
July-November. Saudi Arabia added 90,281 st, followed by 86,427 st from
Australia. Mexico sent 43,592 st.
US Exports:
November DAP exports moved 65.8% lower, to
38,957 st from the year-ago 113,839 st. July-November exports were up 21.7%,
however, to 342,285 st from 281,152 st.
MAP/Other exports fell 9.2% in July-November,
to 765,777 st from the year-ago 843,184 st. Export shipments totaled 143,883 st
for November, however, a 23.0% increase from 117,020 st in the prior November.
Sources reported a 5,000 mt MAP sale destined into a single destination
in northern Latin America. The cargo, priced within the market’s recent
$640-$670/mt FOB range at $650/mt FOB, was scheduled to ship near the end of
January.
Based on reported trades, the US Gulf export phosphate markets shifted
to $650/mt FOB from the week-ago $640-$670/mt FOB.
Eastern Cornbelt:
DAP
offers were quoted at $680-$690/st FOB in the Eastern Cornbelt, down $5-$15/st,
with the Cincinnati market pegged in the $680-$685/st FOB range. MAP pricing
slipped to $675-$685/st FOB in the region, with the low at Cincinnati and the
high at Ottawa.
Western Cornbelt:
DAP
pricing dropped $670-$680/st FOB in the Western Cornbelt, with the St. Louis
market quoted at $670-$675/st FOB. MAP was reported in the same range as DAP
during the week.
Southern Plains:
DAP
was quoted at $670-$685/st FOB Catoosa/Inola, down $5-$10/st, with MAP reported
in the $660-$670/st FOB range at that location, reflecting a $10/st drop. The
Houston market was pegged at $685/st FOB for DAP and $675/st FOB for MAP at
midweek.
South Central:
DAP
pricing in the South Central region was quoted at $680-$690/st FOB, down
$20-$25/st from last report.
Southeast:
MAP pricing from Nutrien remained at $700/st FOB Aurora, N.C., and White Springs, Fla.
China:
Major DAP producer YUC was said to be in steady talks with buyers
looking for the limited tonnage the company has to offer for sale. Sources said
a completed deal of $680/mt FOB is now too high for the current market, and
most of the discussion seems to have centered on $620-$650/mt FOB. So far
nothing has been reported at that level, but sources said it is only a matter
of time before the lower pricing is achieved.
Brazil:
Sources said MAP prices remained stable at $650-$670/mt CFR. There were
reports of buyers pushing for a drop of $5/mt on the upper end, but nothing was
confirmed at that level. Sources said the lower end of the range appeared to be
dominated by Russian and Chinese material.
Rondonopolis showed a slight dip to $780-$810/mt FOB ex-warehouse. The
price change was seen more as a routine fluctuation than as the harbinger of a
major price shift.
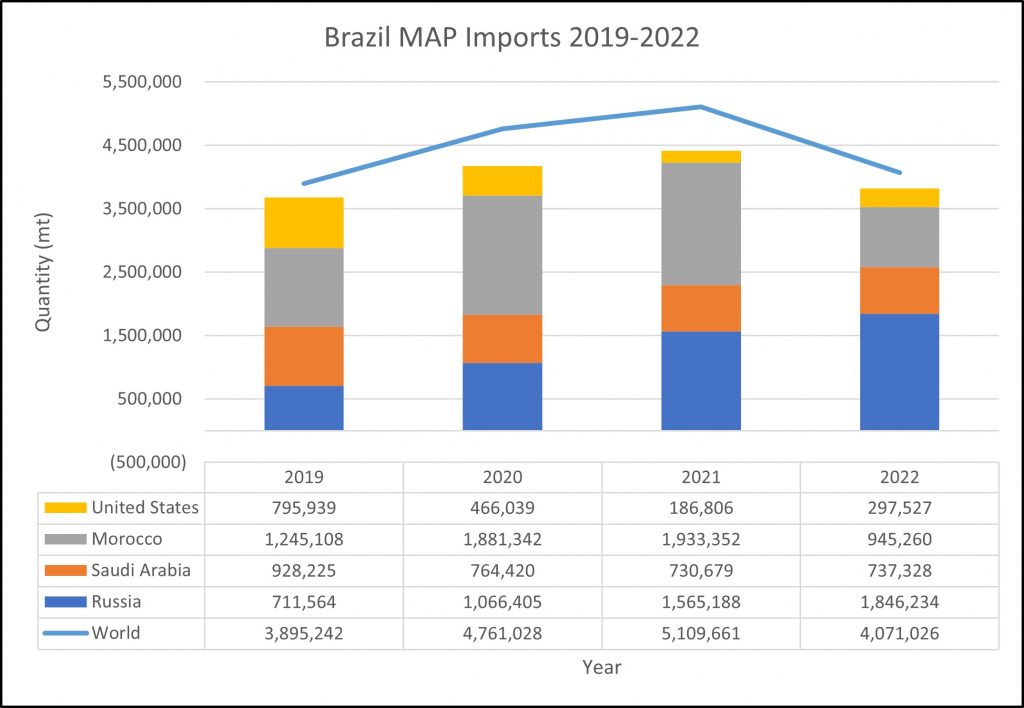
MAP imports for 2022 fell about 1 million mt year-over-year, according
to Trade Data Monitor, to 4.1 million mt from 5.1 million mt. Russia
sent 1.8 million mt, followed by Morocco with 945,000 mt.
December MAP imports were pegged at 234,000 mt, down 44% from 418,000
mt in December 2021, with Russia’s 210,000 mt accounting for 91% of the market.
Fourth-quarter imports fell to 684,000 mt versus the prior-year 1.5 million mt,
while second-half imports were reported at 1.9 million mt, off from 3.1 million
mt.
Phosphate rock imports were up 15.0% in the
July-November period, firming to 1.33 million st from the prior-year 1.16
million st. Imports were up 197.6% in November, lifting to 327,196 st from the
year-ago 109,963 st.
Jordan/India:
Jordan Phosphate Mines Co. (JPMC) on Jan. 10 reported signing an
agreement with Indian Farmers Fertiliser Cooperative Ltd. (IFFCO) to increase
phosphate rock exports from 1.2 million mt/y to 3 million mt/y, starting this
year.
India is looking to reduce its dependency on spot DAP purchases and to
expand its contract-buying resources (GM Jan.
6, p. 11). Increased long-term agreements for phosphate rock will make DAP
production in India easier, and reduce the amount of DAP and NPKs needing to be
imported.
Wet-process phosphoric acid exports firmed
4.6% in July-November, to 140,902 st from the year-ago 134,687 st. Cargoes were
noted at 42,901 st for November, up 5.8% compared to 40,539 st reported one year
earlier.
Eastern Cornbelt:
January
phos acid postings in the Eastern Cornbelt remained at $14.00/unit rail-DEL.
Western Cornbelt:
Phos
acid pricing was unchanged at $14.00/unit rail-DEL in the Western Cornbelt for
January tons.
Southern Plains:
January
pricing for phos acid remained at $14.00/unit rail-DEL level in the Southern
Plains, unchanged from December.
India:
Fourth-quarter India phosphoric acid was noted at $1,100-$1,200/mt P2O5
CFR, off $515-$615/mt P2O5 from $1,715/mt P2O5 CFR in the second and third
quarters.