All posts by mickeybarb@charter.net

Muriate of Potash

U.S. Gulf:

Early-week trades were reported to have reached as high as $535-$540/st FOB for July-August business, with September called $550/st FOB.

Others, however, citing buyer resistance to higher prices, put the NOLA market as low as $510/st FOB, if not lower. Those sources said there is still much lower-priced product to be delivered inland during the third-quarter that was sold earlier by domestic producers.

Eastern Cornbelt:

Potash was quoted at $555-$595/st FOB in the Eastern Cornbelt, with the low reported at Marseilles, Ill. The Cincinnati market was pegged in the $585-$595/st FOB range for limited offers, while pricing FOB Ottawa and East Dubuque was reported at the $575/st FOB level at midweek.

Western Cornbelt:

Sources quoted the potash market at $545-$575/st FOB in the Western Cornbelt for limited offers in mid-July, with Caruthersville pricing pegged at the $550/st FOB level and St. Louis at $570/st FOB. The St. Paul, Minn., market was reported at $555-$575/st FOB during the week.

Southern Plains:

Potash pricing was quoted in a broad range at $535-$575/st FOB Catoosa/Inola in mid-July, depending on supplier and availability. The last postings from Intrepid FOB Carlsbad, N.M., included $540/st for 60 percent white granular and $547/st for 62 percent white standard.

South Central:

The potash market was pegged at $550-$560/st FOB terminals in the South Central region, but offers remained elusive. “As prices started running, liquidity started drying up,” commented one source.

Southeast:

Potash prices were reported in a broad range at $555-$600/st FOB port terminals in the Southeast, depending on location and time of shipment, with the upper end reported for recent prompt offers FOB Wilmington.

Russia:

Potash exports were up sharply for the first five months of the year, according to Trade Data Monitor. Exports totaled 5.07 million mt during the period, some 69 percent higher than the 2.99 million mt reported for the same period last year. May 2021 exports were 1.22 million mt, up from 922,075 mt in April.

The biggest volumes for the first five months went to Brazil, which was up 44 percent; China, up 58 percent; Estonia, up 71 percent; and Indonesia, up 321 percent. Notably, export volumes to the U.S. through May increased 277 percent, to 468,000 mt.

Russian Potash Exports January-May

‘000 mt Jan.-May 2021 Jan.-May 2020 % change
Total exports 5,071 2,991 +69
     
Brazil 1,132 784 +44
China 1,047 663 +58
Estonia 506 295 +71
U.S. 468 124 +277
Indonesia 442 105 +321
Malaysia 283 42 +566
Finland 180 147 +23
India 156 95 +64
Nigeria 141 75 +88
Poland 122 60 +103

India:

FACT closes a tender for the purchase of 40,000 mt of red/pink standard potash in two shipments on July 21 (GM July 9, p. 15). The tender is actually a retender, and calls for the loading of the first shipment in August and the second in September.

Brazil:

Buyers are reportedly holding off on making any purchase of MOP until necessary. This has led to prices reported at $600-$670/mt CFR in Paranagua, with inland prices at Rondonopolis quoted at $715-$745/mt FOB ex-warehouse.

The portside price range widened as buyers tried to push back against higher pricing expectations, and as sellers tried to take advantage of the limited tons available for sale.

The increase of at Rondonopolis is more a reflection of nervousness among farmers about what will happen next. The steady rise in MOP prices is affecting buyers, and some are expecting to see a price correction soon.

As a result, they are refusing to buy too many tons or to take a large forward position. At the same time, MOP is still needed for blending and to top off larger purchases, therefore some purchases still need to be made. Sources said a lot of the inland deals are just hand-to-mouth, but at ever rising prices.
Sulfur

Tampa:

Third-quarter contracts for the price of molten sulfur delivered to Tampa settled on July 15, players reported, with the market’s two largest buyers agreeing to deals with primary suppliers at $195/lt CFR. The updated price represents a $3/lt increase on the second-quarter $192/lt CFR contract, hitting squarely at the center of recent predictions of a $0-$5/lt jump.

The contract’s final landing spot softened from earlier expectations of a possible $10/lt increase due to a confluence of factors, including recent price erosion in the key international markets of China and Brazil. Freight hikes also played a factor, with industry players describing a tussle between buyers and sellers to determine precisely who would be on the hook for these potentially short-term logistics increases.

Further price support came from supply issues in the U.S. domestic market, sources argued, a lingering effect of lost production resulting from the ongoing COVID-19 pandemic.

Following Tampa higher, delivered pricing to Houston was seen moving to $180/lt CFR, rising from $177/lt in Q2, while NOLA deliveries lifted to $184/lt from $181/lt in the prior period.

U.S. Gulf:

Energy Industry monitor Genscape reported a July 8 shutdown of the 174,000 barrel/d crude distillation unit (CDU) and 85,000 barrel/d vacuum distillation unit (VDU) at the Citgo refinery in Corpus Christi, Texas. A 44,000 barrel/d coking unit was also reportedly shut on July 10. The plant’s 69,000 barrel/d No. 2 fluidic catalytic cracking unit (FCC) has been offline since June 18.

Marathon halted production from a 145,000 barrel/d FCC at the company’s Galveston Bay, Texas, facility in the early hours of July 9. Increased activity was observed from the unit on July 10, although activity failed to reach operational levels.

The Galveston Bay plant’s 66,000 barrel/d Ultraformer 4 catalytic reformer was shut on July 11, just days following an unplanned shutdown running from June 29 through July 7. Genscape reported the reformer’s successful restart on the evening of July 12.

A 40,000 barrel/d CDU at Valero’s Corpus Christi West refinery was taken offline on July 10. Multiple units at the plant’s East section were reported going offline on July 14, including a 105,000 barrel/d CDU, a 70,000 barrel/d VDU, and a 17,000 barrel/d coking unit.

Flint Hills restarted operations on a 96,000 barrel/d FCC at the company’s Corpus Christi West plant on July 13, Genscape noted. The unit had been offline since June 20 due to a mechanical failure.

Mild softening in international values combined with rising freights to pressure U.S. Gulf price ideas lower, players indicated, with most quoting the market in the $190-$195/mt FOB range, down from the last reported $190-$200/st FOB.

Brazil:

Last-done Brazil spot transactions were heard in the $221-$230/mt CFR range, unmoved from the prior report. Indications for the next round of business were heard shifting toward the lower end of the spread.

Early third-quarter import contracts were reported landing in the $221-$223/mt CFR range, increasing from $213-$214/mt CFR in the prior period.

Caribbean:

The owners of the Limetree Bay refinery, located on the U.S. Virgin Island of St. Croix, have filed for bankruptcy, Reuters reported, after announcing the permanent shutdown of the 210,000 barrel/d plant in June. A temporarily shutdown was ordered in May after the refiner repeatedly ran afoul of EPA regulators.

Limetree is reportedly seeking to obtain up to $25 million in financing through the bankruptcy action. The plant, once a 600,000 barrel/d behemoth boasting the largest capacity in the Western Hemisphere, was restarted in February after sitting idle since 2012.

Vancouver:

Weakening exchange rates were noted shaving values from USD-priced markets, resulting in netbacks falling to around $175-$178/mt FOB, off from $178-$180/mt FOB reported previously.

Alberta:

Alberta netbacks shifted slightly to $65-$108/mt FOB due to reported declines at Vancouver, down from $65-$110/mt FOB noted one week earlier.

West Coast:

Marathon took a 105,000 barrel/d CDU offline at its Wilmington, Calif., refinery during the week, Genscape reported on July 12. Decreased activity was simultaneously observed from a 42,000 barrel/d coking unit and a 15,000 barrel/d catalytic reformer.

West Coast prills were seen slipping to $175-$178/mt FOB, falling from $178-$180/mt FOB at last report. Molten sulfur contracts for tons loading from West Coast locations was reported in the $150-$155/lt FOB range, a change from $140-$155/lt FOB in the second quarter.

China:

Last-done spot imports at China fell to the $213-$216/mt CFR range, sources said, slipping from $217-$220/mt CFR one week earlier. Players attributed the lower values to firming freight costs and a weaker dollar, rather than to weakening demand.

ADNOC:

The Abu Dhabi National Oil Co. offered prilled sulfur cargoes at a reported $175/mt FOB Ruwais for loading in July, a $10/mt decrease from the prior month’s $185/mt FOB.

Qatar:

Solid sulfur produced by Qatar Petroleum and marketed by Muntajat was noted at $179/mt FOB Ras Laffan for the current month. Muntajat was posted at $183/mt FOB in June, a $4/mt difference.

Kuwait:

Sulfur exported from Kuwait moved to $180/mt FOB for July, sources said, falling from $183/mt FOB in the prior month.

Sulfuric Acid

U.S. Gulf:

No new price ideas were mentioned on the week’s U.S. Gulf sulfuric acid vessel market, leaving the range at $190-$195/mt CFR.

Gulf Coast:

Gulf Coast tons were heard at $85-$110/st DEL for 2021 contracts, unchanged from the prior report.

Midwest:

Sulfuric acid volumes delivered to the U.S. Midwest were quoted at $85-$110/st DEL.

West Coast:

Sources described West Coast contracts in the $100-$130/st DEL range for the 2021 contract year.

Brazil:

Recent Brazil values were understood to remain in the $195-$200/mt CFR range, unmoved from the prior report.

China:

Copper smelters in China produced 745,700 mt of refined copper for the month of June, according to China state-backed researcher Antaike and reported by Mining.com. The numbers represented a 3.6 percent decline from May, but firmed 6.7 percent year-over-year from June 2020.

Ammonium Thiosulfate

Eastern Cornbelt:

Ammonium thiosulfate pricing was steady at $400-$485/st FOB in the Eastern Cornbelt, with the low at Ottawa and the high out of inland warehouses in Ohio. The last offers out of Terre Haute, Ind., were quoted at $430-$450/st FOB.

Western Cornbelt:

Sources quoted limited ammonium thiosulfate tons priced at the $430-$450/st FOB level in Iowa.

Southern Plains:

The ammonium thiosulfate market remained at $325/st FOB Houston for the last offers.

SOP Magnesia

Southern Plains:

The latest Trio postings from Intrepid FOB Carlsbad included $320/st for standard, $355/st for granular, $365/st for premium, $395/st for OMRI standard and fine standard, and $430/st for OMRI granular.

Southeast:

SOP Magnesia pricing in Florida was reported at $415/st FOB for standard and $450/st FOB for premium grade, up some $35/st from last report. Sources quoted rail-DEL premium offers at the $465/st level in the Carolinas.

Crops/Weather

Eastern Cornbelt:

U.S. Drought Monitor

After a weekend of heavy rain and additional thunderstorm activity at midweek, several central Illinois counties were under a flash flood warning on July 15. Multi-day rainfall totals ranged from 2-4 inches across parts of central and northern Illinois.

Saturated field conditions were also reported in central Indiana, with some areas posting 12 inches of rain since the start of summer. Forecasts warned of an addition 1-2 inches over the coming weekend.

Strong storms were also tracking through parts of central and northern Ohio during the week, with forecasts warning of up to three inches of rain and gusty winds in northeastern areas of the state on July 15.

Crop conditions remained favorable in the region in mid- July. Good or excellent ratings were assigned to fully 75-79 percent of Ohio’s corn and soybeans on July 11, compared with 70-73 percent in Indiana and 56-60 percent in Illinois. The winter wheat harvest had reportedly progressed to 95 percent complete in Illinois, 77 percent in Indiana, and 69 percent in Ohio by that date.

Western Cornbelt:

Corn, Wheat, Soybean Index

A band of strong thunderstorms churned through parts of central, northern, and eastern Iowa on July 14, with extensive crop and structural damage reported due to damaging winds, hail, and at least 12 confirmed tornadoes.

The previous weekend also brought severe thunderstorms to parts of western Nebraska, with reports of baseball-sized hail in Alliance, Neb., on July 9. Another round of storms tracked through parts of the Nebraska Panhandle on July 13.

Missouri was also in the crosshairs at midweek, with 1-4 inches of rain reported across a swath of central Missouri on July 15.

Crop conditions remained very favorable in Nebraska, where 77-79 percent of the corn and soybeans were rated as good or excellent, along with 80 percent of the sorghum. USDA placed 65-66 percent of Iowa’s corn and soybeans in the good or excellent categories on July 11, compared with 56-61 percent in Missouri. Cotton and rice crops in Missouri were 69 percent good or excellent on that date.

Southern Plains:

Strong thunderstorms were moving through parts of Kansas as the week progressed, with reports of strong winds and heavy rain in some locations. Forecasts warned of 1-3 inches of rain in Topeka at midweek, prompting a flash flood watch. Even higher amounts were expected in northeastern areas of the state.

Strong to severe storms also swept across central Oklahoma over the previous weekend, with reports of high winds, hail, and heavy rain in some areas. Sources in western Texas reported hot, dry weather at midweek, with temperatures climbing to the upper-80s and 90s.

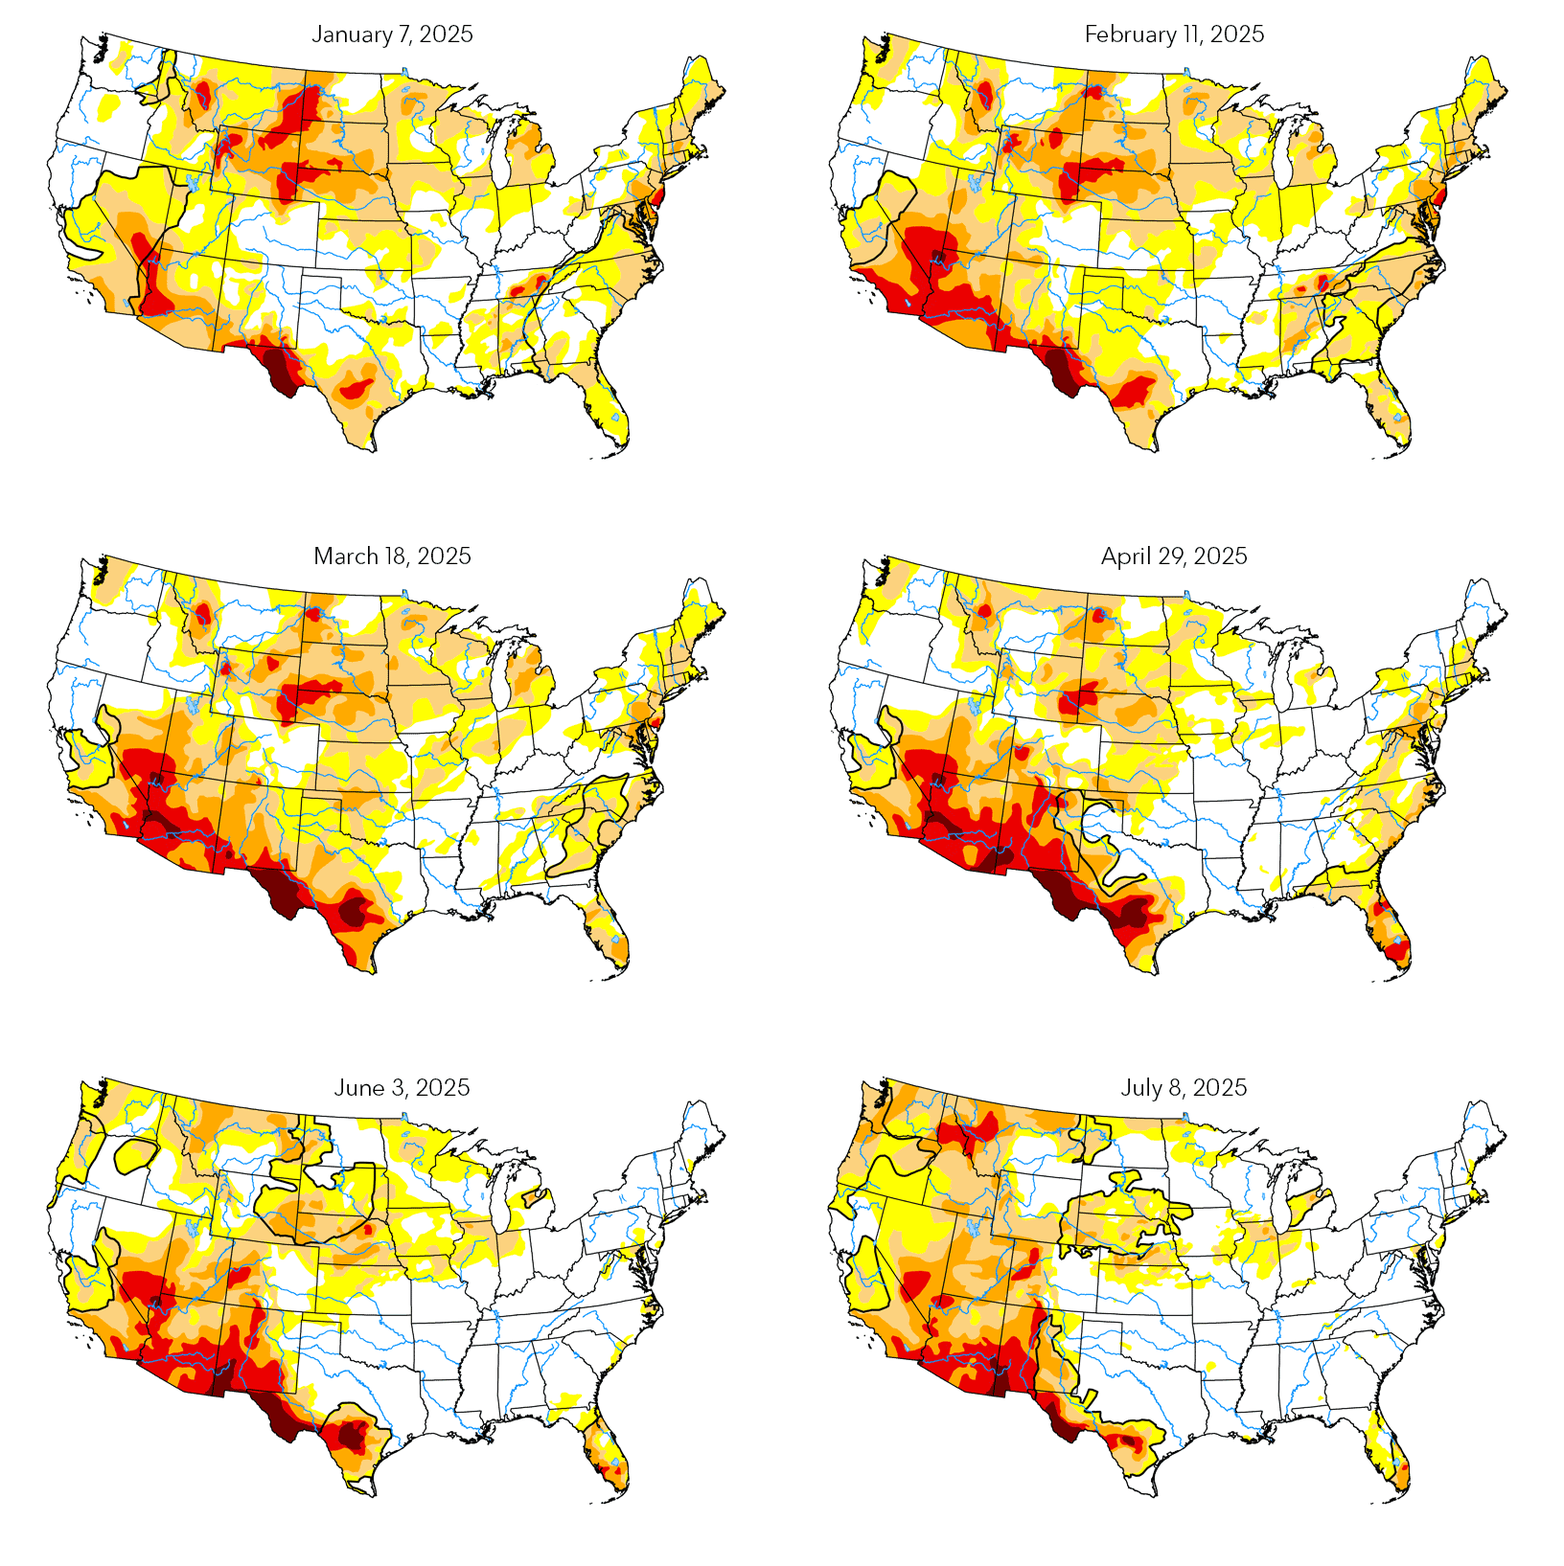
The U.S. Drought Monitor on July 15 continued to report a wide band of extreme-to-exceptional drought extending from central and northern New Mexico into western Colorado. While much of eastern Colorado was drought-free, nearly all of New Mexico was experiencing some form of drought at mid-month.

Thanks to what one source described as some “drought-busting rains” across Texas in June, crop conditions were generally favorable in the region. Fully 77 percent of Colorado’s corn was rated as good or excellent on July 11, compared with 70 percent in Kansas and 68 percent in Texas. The Kansas soybean crop was 62 percent good or excellent, while cotton in those two categories totaled 43 percent of the acreage in Texas and 65 percent in Kansas and Oklahoma.

The regional sorghum crop looked great in mid-July, with good or excellent ratings assigned to 90 percent of the acreage in Oklahoma, 80 percent in Colorado, 73 percent in Kansas, and 67 percent in Texas.

South Central:

Strong thunderstorms churned through parts of northern Arkansas, southern Kentucky, and Middle Tennessee on July 10-12, with reports of damaging winds and large hail in some locations. High heat and humidity was reported in Louisiana and Mississippi during the week.

Plenty of heat and moisture this summer has contributed to favorable crops conditions in the South Central region. Fully 80-84 percent of the corn in Tennessee and Kentucky was rated as good or excellent on July 11, while soybeans in those two categories totaled 81 percent of the acreage in Kentucky and Mississippi, 78 percent in Louisiana, 76 percent in Tennessee, and 67 percent in Arkansas.

The cotton crop was also described in very favorable terms, with good or excellent ratings assigned to 62 percent of the acreage in Tennessee, 72 percent in Mississippi, 82 percent in Arkansas, and fully 95 percent in Louisiana.

Sources reported “a very healthy urea rice run” this year, thanks to an early start and what one contact described as “a heavy tail.” Some areas were expecting demand for the final application to continue for another 7-10 days. USDA placed fully 86 percent of Mississippi’s rice crop in the good or excellent categories at mid-month, compared with 65-68 percent in Louisiana and Arkansas, and 55 percent in Texas.

Southeast:

Much of the Southeast experienced high heat and humidity at mid-month, with frequent afternoon thunderstorms popping up on the radar.

Severe thunderstorm warnings were issued at midweek for parts of Virginia and Maryland as the Mid-Atlantic region sweltered under steamy weather conditions. Florida was also experiencing widespread showers from a tropical wave during the week

One week earlier, Tropical Storm Elsa brought wind and rain to parts of Georgia, North Carolina, and Virginia. Rainfall totals across central North Carolina ranged from 1-3 inches as Elsa passed through, with 50 mph wind gusts reported in some locations.

Surplus moisture contributed to favorable crops conditions in mid-July. USDA assigned good or excellent ratings to 78 percent of North Carolina’s corn and 67 percent of the state’s soybeans on July 11, while cotton in those two categories totaled 64 percent of the acreage in North Carolina, 74-75 percent in Georgia and South Carolina, 82 percent in Alabama, and 92 percent in Virginia.

The regional peanut crop was also described in very favorable terms, with good or excellent ratings assigned to 67 percent of the acreage in Florida, 76-77 percent in North Carolina and Georgia, 85-86 percent in Alabama and South Carolina, and 95 percent in Virginia.

Transportation

U.S. Gulf and Atlantic:

Handysize Shipping Index

Delays continued to be reported at Port Allen Lock due to restrictions related to a damaged guidewall, with Corps data revealing intermittent wait times stretching to 10.5 hours through the site. Unassisted tows moving to the west were capped at a single barge per turn, while westbound boats towing two or more barges were required to use an assist vessel. Eastbound tows longer than 650 feet were also required to utilize an assist vessel.

Algiers Lock size restrictions continued to effectively limit tows to four standard barges or two 30,000 mt tankers on unassisted lockages, although longer tows were said to remain possible with the use of an assist vessel. Delays were typically heard in the 3-5 hour range for the week.

Bayou Chene movements were unavailable between 7:00 p.m. and 7:00 a.m. daily due to ongoing construction and dive activities. Delays were noted in the 6-12 hour range as a result, while the use of an assist vessel was reportedly required on all trips through the waterway.

Bayou Sorrel Lock delays were heard up to seven hours for the week, while boats traveling through Industrial Lock waited 10-17 hours to pass. Colorado Lock transit carried wait times up to 5.5 hours, and Brazos Lock travel was delayed up to 37 hours for the week. Inclement weather sparked intermittent travel delays in both the East and West Canals.

The National Hurricane Center reported a tropical disturbance crossing Atlantic shipping lanes northeast of Bermuda on July 15. The storm system was not expected to strengthen prior to July 17.

Mississippi River:

River levels were noted improving at St. Louis during the week, allowing for the partial lifting of restrictions on movements between St. Louis and Cairo, Ill.

Maximum southbound tow sizes returned to the 25-cargo limit, up from 20 barges in the prior report due to fast flows. Overnight navigation restrictions previously in force were rescinded on a number of bridges in the area, although daylight-only travel remained in place on a case-by-case basis through the bridge at Thebes, Ill.

The Lock 27 auxiliary chamber is scheduled to remain closed to travel through July 27 for repairs to the lower bullnose. Repair operations will move to the upper bullnose on Aug. 2, shutting the site’s primary lock chamber until Aug. 19.

Lock 2 miter gate installation remained scheduled for July, sources said. Lock travel is expected to see intermittent 4-12 hour delays during daytime hours once the project is underway.

Lock 14 delays were reported at 5-8 hours on July 14, while 5.5 hour waits were noted through Lock 27 on July 13.

Illinois River:

Navigation through the Beardstown Railroad Drawbridge was unavailable between 8:00 a.m. and 2:00 p.m. on July 12-13 due to scheduled repairs.

Falling water levels failed to reach low enough levels to raise wickets at both Peoria Lock and LaGrange Lock for the week, leaving both sites open to lockless navigation.

Ohio River:

The McAlpine Lock upper chamber was heard to remain shut during the week due to ongoing dredging and repair activities, prompting traffic to pass solely through the lower chamber. As a result, intermittent delays were noted up to 10 hours.

Main chamber maintenance and repairs that began on June 21 at Cannelton Lock are scheduled to run through Nov. 19, forcing vessels to pass through the secondary chamber.

Structural cracks in the Markland Lock auxiliary chamber miter gate will reportedly keep that chamber shut to transportation through an estimated Oct. 29. Navigation has remained available through the primary chamber.

The primary lock chamber at Montgomery Lock is on the books to close for repairs from July 26 through Aug. 24, prompting boats to lock through the secondary chamber. The main chamber will go offline again later in the year, forcing detours through the auxiliary chamber between Oct. 18 and Dec. 17.

Braddock Lock’s main chamber will go offline from Sept. 13 through Oct. 15, prompting detours through the secondary chamber. The Willow Lock main chamber will close to travel on Oct. 1-31. Boats will pass through the auxiliary chamber while work is underway, and delays are expected.

A brief return to locking at Olmsted Lock was due to end on July 12, when lock operators were projected to begin the roughly 24-hour process of lowering the site’s wicket system. Following the change, tows were expected to pass through the navigational pass.

Delays through the Tennessee River’s Kentucky Lock were generally noted in the 7-13 hour range for the week.

Repairs to the Cumberland River’s bio-acoustic fish fence (BAFF) system at Cheatham Lock were expected to conclude on July 15, ahead of the previous July 22 schedule.

Arkansas River:

David D. Terry Lock is due to shut for a complete dewatering and repair operation between Aug. 27 and Sept. 9, effectively closing the river at the site. Preceding the full shutdown, intermittent stoppages are expected on Aug. 16-26.

Yara 2Q Beats Analysts’ Estimates; Improved Prices & Recovering Premiums Boost

Yara International ASA, Oslo, reported a 142 percent increase in second-quarter net income, to $539 million on revenue of $3.95 billion, up from the year-ago $223 million and $2.87 billion, respectively. Basic earnings per share were $2.10 versus the prior year’s $0.83 per share. Excluding currency effects and special items, second-quarter basic earnings per share were $1.42 compared with $1.06 a year ago.

Second-quarter EBITDA excluding special items was 32 percent up on the year, at $775 million versus the year-ago $588 million. Revenue was up 38 percent.

Net income, adjusted EBITDA, and revenue all beat analysts’ average estimates, according to a Bloomberg consensus.

  2Q result Analysts’ average estimates Range
Net income $ million $539 $372.2 $302.0 to $448.0
Adjusted EBITDA $ million $775 $752.1 $657.0 to $816.0
Revenue $ billion $3.95 $3.48 $2.93 to $4.14

“Yara delivered its twelfth consecutive quarter with improved capital returns, with EBITDA excluding special items up 32 percent reflecting improved pricing and recovering premiums,” said Yara International President and CEO, Svein Tore Holsether.

He said the company’s realized premiums have started to normalize following an earlier compression of premiums amid the rapid rise in commodity nitrogen prices.

The improved pricing more than offset increased energy costs, fixed costs, and currency effects, the company said.

Yara’s industrial business has also picked up, following weaker demand during the start of the COVID-19 pandemic.

Holsether said Yara cash flow improved further in the reporting quarter, with almost $3 billion of free cash flow generated over the last four quarters. As a result, the company will propose a NOK20 per share additional dividend payment in the third quarter, in line with Yara’s capital allocation policy. It already paid an annual dividend of NOK20 per share in May.

Yara’s total deliveries for the second quarter ticked up by just over 1 percent, to 9.78 million mt, up from the year-ago 9.65 million mt. But fertilizer deliveries fell 3 percent to 7.35 million mt, down from 7.58 million mt.

In Europe, deliveries were down 16 percent. Strong fertilizer price increases led buyers to cover only the necessary volumes for current season application, following relatively strong purchasing earlier this season, the company said.

For the Americas, overall deliveries decreased 2 percent, mainly reflecting phasing of deliveries following the early season last year.

Industrial product deliveries rose 20 percent to 1.84 million mt, reflecting higher deliveries, improved margins, and improved reliability in the production units, the company said. Ammonia trade increased 13 percent to 589,000 mt.

Yara’s gas costs for the third quarter are expected to be $380 million higher than a year earlier, and for the fourth quarter $300 million higher than a year earlier.

First-half net income came in at $553 million ($2.13 per share) on revenues of $7.09 billion, up from the year-ago $105 million (0.39) and $5.72 billion, respectively. Adjusted earnings per share was $2.22 versus the previous year’s $1.45.

Six-months EBITDA excluding special items increased 25 percent, to $1.36 billion, up from $1.09 billion.

“Yara’s industry fundamentals are robust, as the twin challenges of resource efficiency and environmental footprint require significant transformations within both agriculture and the hydrogen economy,” said Holsether.

Yara’s leading food solutions and ammonia positions are well placed to both address and create business opportunities from these challenges, he said.

Yara Production and Deliveries

‘000 mt 2Q-2021 2Q-2020 1H-2021 1H-2020
Production        
Ammonia 1,891 1,868 3,684 3,792
Finished fertilizer and industrial products (excluding bulk blends)1 5,074 5,108 10,233 10,418
         
Yara Deliveries        
Ammonia trade 589 523 1,047 943
Fertilizer 7,347 7,584 14,201 14,427
Industrial product 1,843 1,542 3,610 3,263
Total deliveries 9,779 9,648 18,858 18,634

1 Including Yara share of production in equity-accounted investees, excluding Yara-produced blends

Yara Deliveries

‘000 mt 2Q-2021 2Q-2020 1H-2021 1H-2020
Crop Nutrition Deliveries        
Urea 1,800 1,539 3,168 2,965
Nitrate 1,171 1,357 2,763 3,015
NPK 2,280 2,477 4,728 4,848
CN 476 463 958 861
UAN 378 505 761 861
DAP/MAP/SSP 335 301 482 449
MOP/SOP 516 443 665 566
Other products 392 499 676 861
Total Crop Nutrition Deliveries 7,347 7,584 14,201 14,427
         
Europe Deliveries        
Urea 263 244 556 552
Nitrate 764 1,041 1,920 2,310
NPK 471 533 1,395 1,471
CN 129 152 265 262
Other products 409 447 821 892
Total Deliveries Europe 2,035 2,417 4,957 5,487
         
Americas Deliveries        
Urea 786 715 1,416 1,336
Nitrate 304 243 670 592
NPK 1,305 1,502 2,420 2,554
CN 302 272 602 522
DAP/MAP/SSP 321 274 429 384
MOP/SOP 486 421 606 521
Other products 333 489 576 748
Total Deliveries Americas 3,837 3,915 6,718 6,658
       
North America 1,064 1,085 2,022 1,944
Brazil 2,209 2,292 3,675 3,755
Latin America excluding Brazil 564 538 1,021 959
         
Africa & Asia Deliveries1        
Urea 751 580 1,197 1,077
Nitrate 103 74 173 113
NPK 504 442 914 823
CN 46 39 91 77
Other products 71 117 152 192
Total Deliveries Africa & Asia 1,475 1,252 2,527 2,282
Asia 1,151 895 1,962 1,688
Africa 324 357 565 594
         
Industrial Solutions Deliveries        
Ammonia2 132 137 282 278
Urea2 410 354 807 764
Nitrate3 298 272 578 549
CN 46 42 92 84
Other products5 420 301 826 671
Water content in industrial ammonia and urea 537 436 1,024 917
Total Industrial Solutions Deliveries 1,843 1,542 3,610 3,263

1 The Africa and Asia business also includes Oceania

2 Pure product equivalents

3 Including AN Solution

4 Including sulfuric acid, ammonia, and other minor products